Editor’s Note: For 23 years the principal goal of the Planning Commissioners Journal and PlannersWeb.com has been to help planning commissioners be more effective in their role on their commission.
We’ve run many articles on this, offering suggestions from both professionals and from other citizen planners. We’ve also delved into questions like: How do you best get public input at meetings? How do you strengthen the commission’s relationship with the governing body? and How can staff best assist you?
This past August, we asked PlannersWeb readers to take 15 to 20 minutes to respond to a questionnaire we prepared.
Our aim was to get a better sense of how well planning commissions across the country are working …
Our aim was to get a better sense directly from you our readers of, among other things, how well planning commissions across the country are working, what commissioners and staff view as most important to their respective roles; and what it takes to run an effective public meeting or hearing.
All told, 437 individuals provided replies. Several of the questions only asked planning commissioners to respond. This will be further noted when we post summaries of the responses to specific questions.
Over the next two weeks, we’ll be posting summaries of what we heard back from you. The postings will cover:
About Planning Commissioners:
- Length of Service on Commission
- Who Selects Commissioners
- Recruiting New Members
- Ethnic & Demographic Diversity
- Reasons for Interest in Serving
- Most Important Skills for Commissioners to Have
About Planning Staff:
- Most Important Skills for Staff Planners to Have
Planning Commission Basics:
- Frequency & Duration of Meetings
- Planning Commission Dynamics
- Holding Effective Public Meetings
- Improving Effectiveness of Commissions
- Commission-Governing Body Relations
Our questionnaire was not designed as a random, statistically-based survey. It was open to anyone to respond to.[ref]In fact, we believe it would be extraordinarily difficult to design a random survey of planning commissioners, given the variability in number and location of planning commissions across the U.S. What’s more, some states just happen to have many more planning commissions (and planning commissioners) per capita than others, depending on the number of towns, cities, and counties in the state; historic patterns; and other factors.[/ref] What we’ll be reporting to you is more qualitative in nature. We asked quite a few “open-ended” questions where — after reading all of the responses (in many cases, hundreds of responses per question) — we grouped them into various categories. This helped us avoid “pre-judging” what issues were most important to you.
The charts below will give you a sense of who replied to our questionnaire.
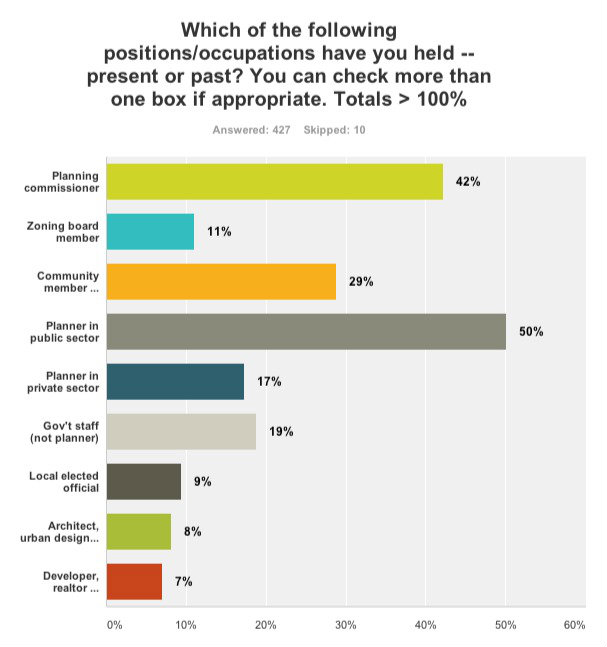
1. What Positions Have Our Survey Respondents Held
We asked respondents to indicate which of the following positions they have held (either currently or in the past). Many checked off more than one box, so the totals come to well over 100%.
2. Where Do Our Survey Respondents Live?[ref]The map we show groups respondents by region — using the Bureau of Economic Analysis’ regional demarcations. While we feel we received a fairly good regional distribution of responses, it’s very hard to know for sure. Again, in some states — even smaller ones — there are simply more planning commissions and commissioners than in others. Also, we have more readers in some states than in others, and our respondents may reflect that “bias” since the survey was primarily distributed to PlannersWeb readers.[/ref]
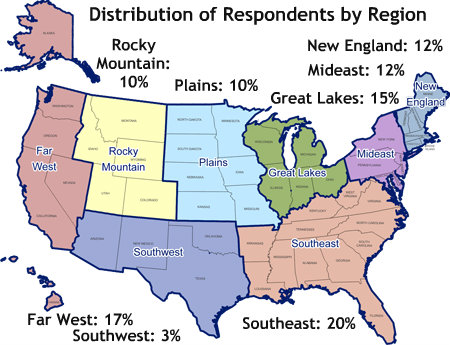
States with Largest Number of Survey Respondents:
1. California: 30
2. Virginia: 28
3. Colorado: 23
4. Michigan: 22
5. Washington: 20
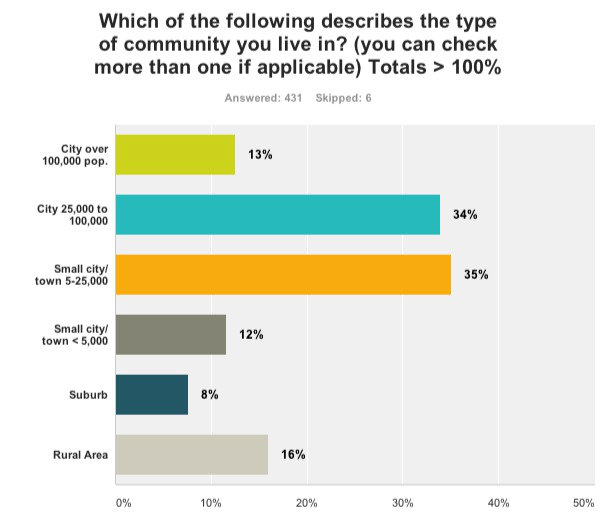
We also asked respondents to indicate the type of community they live in. Note that the percentages are greater than 100%, as we asked respondents to check more than one box if appropriate (for example, if they felt they lived in a town, which they also considered to be a suburb).
Our Next Post: Length of Service on Commission, Who Selects Commissioners, and Recruiting New Members