 We are now approaching the proverbial “bottom line” of the feasibility analysis. How much money will this project make?
To see where we stand, we subtract the Total Project Costs, just estimated above, from our earlier estimate of Net Project Revenues. This yields a value of $1,989,500, indicated in Figure 1 as Net Cash Flow Before Financing. This is not yet, however, the final bottom line.
Financing Interest:
One remaining cost item is financing interest. A basic aspect for nearly all real estate is that costs are incurred first, and revenues come in second. The costs have to be covered with financing and investment until sales or rents are able to be collected. As this money is advanced, interest charges are added to the costs the project carries. Interest costs can be a major factor in the profitability of a project, particularly if the sales and development period becomes extended.
Project financing is an area for which strategies vary widely, from builder to builder, and from project to project. While there is probably no standard approach, one not uncommon financing scenario would have a land purchase loan cover a large part (but not all) of the land acquisition costs, and short-term project financing cover all other development costs as they are incurred. Both of these loans would be repaid with calculated payment allocations per house as each home sale is closed. Interest charges would be incurred on the outstanding balance of these loans until they are completely paid.

In order to calculate the project’s financing needs and the amount of interest that will be charged, we have to anticipate the timing of when costs will be incurred and when revenues will be available to pay the loans back. This requires preparing a cash flow analysis.
Although cash flow tables can look very complex, they really are nothing more than a schedule of when revenues and expenses are expected to be incurred. Figure 2 shows just a portion of the cash flow analysis that is part of our case study proforma, focusing on the end of the project’s second year and beginning of the third year. You can see the first house closings occurring in Year 3, Quarter 1, generating the project’s first revenues and cash flows.
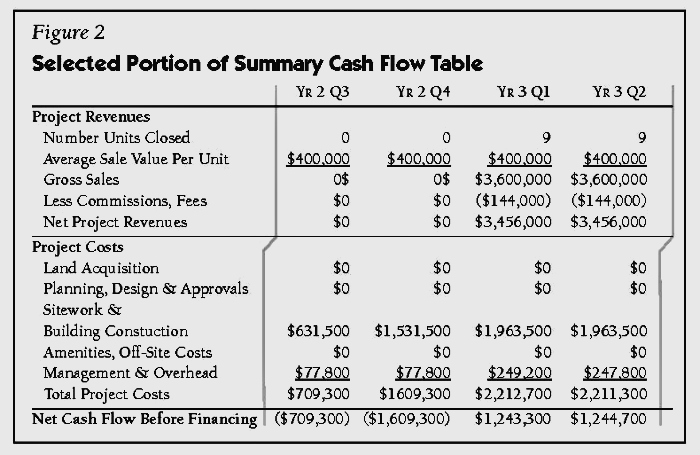
A cash flow analysis also shows the impact of time on the project’s feasibility. A project that takes longer to build or sell will have more exposure to costs that are not yet covered by rent or sales revenues. On-site staffing costs continue to run, interest costs mount up, and there is an increased chance that prices for construction materials and services may increase.
Knowing the expected schedule of when costs will be going out and revenues coming back in, we can now estimate the financing needs for the project. The full cash flow analysis extends beyond what can be shown in this article, but it includes a financing table that calculates the amount of new borrowing that will be needed each quarter, how much interest will be charged on the outstanding loan balance, and how much of that balance is repaid from each home sale.
 Adding up all the interest charges from each quarter in the cash flow analysis gives us our financing costs. In our case study example, our cash flow analysis calculates this amount to be $1.1 million, and this is the amount that is then listed in Figure 1 as Financing Interest.
In addition to calculating financing costs, a cash flow analysis helps us understand the impact of time on the project’s feasibility. A project that takes longer to build or sell will have more exposure to costs that are not yet covered by rent or sales revenues. On-site staffing costs continue to run, interest costs mount up, and there is an increased chance that prices for construction materials and services may increase.
Of note at this point is adding up the project costs that are not being financed by lenders. Again, this is highly variable from project to project. The approach taken in our case study is to assume that lenders will finance 70% of the Land Acquisition costs, which means the developer will be covering the balance. Furthermore, the primary project loan will probably not be funded until six months into the project, by which time the land purchase would be completed and initial project approvals obtained.
Thus, during this initial period, costs in excess or preceding the availability of the loans will be borne by the developer. This is the cash that the developer has at risk for the project and is the basis for calculating the rate of return.
Net Cash Flow to Developer:
The time has come at last to calculate the project’s profit. In Figure 1, we subtract the Financing Interest from the Net Cash Flow Before Financing. The result is indicated as Net Cash Flow to Developer, estimated in Figure 1 at $887,100.
So, is this a sufficiently attractive financial return to be worth all the risk and effort?
The developer’s initial Cash Investment is estimated from the cash flow analysis, and is indicated near the bottom of Figure 1 as $1,020,600 based on the funding scenario described above. This is what the developer must cover from his own resources until this money is returned to him with the initial disbursements from the project financing. The Net Cash Flow to Developer is what his investment earns.
As seen near the bottom of Figure 1, comparing the Net Cash Flow to Developer to the Cash Investment yields a Total Cash-On-Cash Return rate of 86.9%. This may seem huge at first, but remember that the project will be in its fourth year before this is achieved. This total cash return is actually equivalent to a rate of return of 19.9% on an annualized basis, as indicated at the bottom of Figure 1.
 One final indication of profitability is the Internal Rate of Return (IRR), shown in the very last line of Figure 1 as 22.4%. The importance of the IRR is that it takes into account the impact of time on an investment and the returns it generates. The IRR incorporates all of the cash flows initially going out (investment) and then coming back in (returns) and the exact timing of each. The IRR then finds the single rate of return that mathematically matches all of these cash flows, both in and out, to the amount of time that has passed, and the final net total of returns received.
Calculating an IRR involves a repetitive trial-and-error process, which is why it is handled as an automatic function in spreadsheet programs. The IRR is a standard indicator of profitability used in financial analyses that is particularly useful for comparing one investment against another.
One final indication of profitability is the Internal Rate of Return (IRR), shown in the very last line of Figure 1 as 22.4%. The IRR is a financial calculation based on a series of cash flows initially going out (investment) and then coming back in (returns). It essentially solves for a rate of discount that would make the net value of future cash flows equal zero. An IRR value above the expected rate of inflation would be a positive finding, and the higher the IRR value, the more valuable your future cash flows will be in today’s values. IRR values are a standard indicator of profitability used in financial analyses.
 Rates of return approaching 20% may seem ambitious, and, in fact, may not be achieved. Viable projects can have return rates of 15%, 12%, or even less.
But lower levels of return are usually acceptable only when builders perceive a quick turnaround, or a lower level of risk. After all, the feasibility analysis is done before the first spade of earth is turned.
The greatest risk in development is the unforeseen: what is discovered on the site that was not previously known; new regulations or other factors that add unforeseen costs; or turns in the market that result in lower sales values or extended sales periods.
Annualized rates of return of, say, 10%, can be achieved with investments that carry far less risk. Allowing for strong rates of return reflects the high level of uncertainty and risk that is inherent with real estate development.
A Note about Developers’ Financial Information
Developers should not ordinarily be expected to present their confidential financial analyses (including expected profit margins) when they seek approval for their project.
 Financial information on projects and businesses belongs to the corporations that produce it. Whether or not a business is going to make a profit, or how much profit it stands to make, is not a criterion for granting or denying approvals under local land use and zoning ordinances.
If you are buying a car, the car dealer does not have the right to obtain your bank balance so that he can raise the price to as much as you can possibly afford. In the same way, a planning board is not entitled to know the profitability of a project so that it can run up a list of amenities and community improvements at the expense of the project.
In the development approval process, the situation is further complicated by being conducted in a public forum. This means that anything that a developer submits in response to requests from the board is subject to public inspection, which could very well include the developer’s competitors. No developer should have to expect to reveal all of the project’s financial projections just to get the project approved. Preserving business secrets is a legitimate interest of any developer. Usually, such proprietary interest is protected by law.
 Since such information cannot be obtained directly from the developer, it becomes even more important that planning board members have a base level of sensitivity to the business side of the development process. This includes having current awareness of prices, rent levels, and vacancy rates as found in the local, current market. It also means understanding how changes to one aspect of a development project can affect other parts, as well as the project’s overall feasibility.
In the next and final part of the article, a look at some alternative development scenarios.