In Part 2 yesterday, Tom Miller covered his first three “rules” for completing a citizen survey — focusing on why a survey is needed; how much to spend on it; and how to put a team in place to prepare and conduct the survey. In today’s installment, he focuses on identifying the target population; determining the sample size; and asking the right questions — in the right way. The article concludes tomorrow.
4. Identify the Target Population and Sample
Opinion surveys are attractive planning tools because, when properly done, they provide an efficient way to collect information about a community. This is because surveys generally focus on small, but representative, samples of the entire community. In fact, the most crucial issue related to survey samples is how well they represent the overall population or community of interest — the “target population.”
A representative sample identifies potential respondents in a way that does not systematically exclude any group from the community. For example, if Latinos comprise ten percent of your community’s population, they should also make up about ten percent of your survey respondents. A representative sample is drawn from a “sampling frame,” which is a complete list or representation of everyone in a target population who could be surveyed. (A voter registration list is the sampling frame for a survey of registered voters; a list of phone numbers generated at random is the sampling frame for a survey of everyone in the community with a telephone).
Constructing a sampling frame can be relatively straightforward, or it can be difficult, depending on the target population. The sampling frame for a target population of parents of children in public recreation programs could most likely be developed using recreation department program registration records. A sampling frame for members of the community who are over 60 years old, on the other hand, might have to be compiled using telephone directories, property tax records, utility records, commercial mailing lists, and motor vehicle registration. For reasons of practicality, it is not uncommon to define sampling frames by the information that is available.
5. Determine the Size of the Survey Sample — and How to Best Reach Those in the Sample
The primary purpose of a sampling frame is to identify individuals who actually could be surveyed, since well-constructed samples allow us to survey a relative few from the target population. Those individuals who are selected to be surveyed are part of the survey sample. 
People in a sample serve, essentially, as tokens representing a larger number of people. By using random selection to identify those in the survey sample, it is possible to generalize survey results and apply them to a target population as a whole.
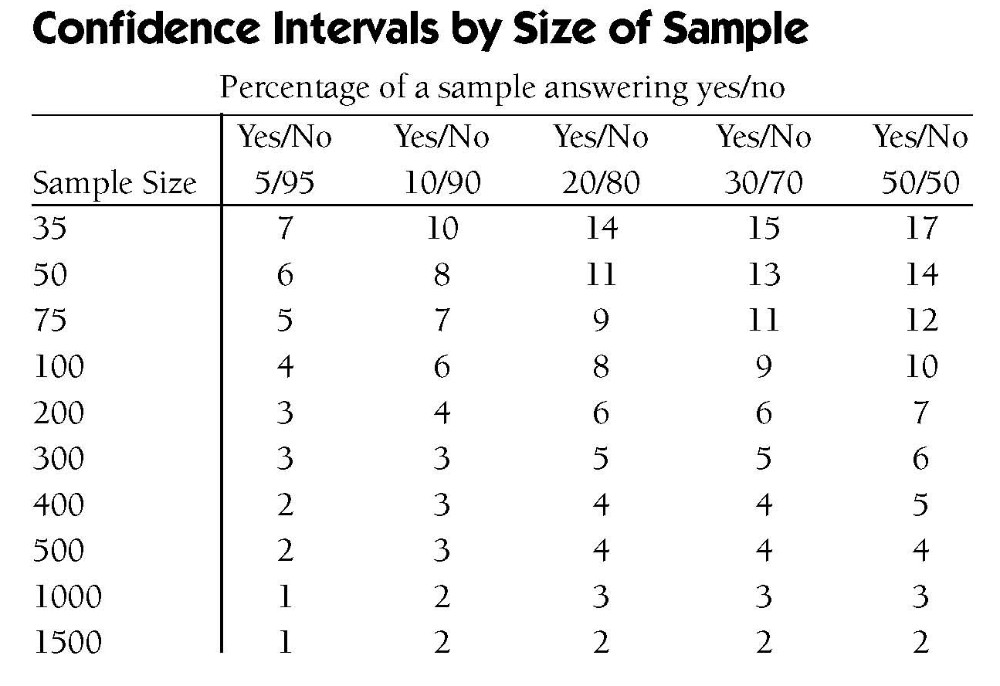
Drawing a sample from a sampling frame is usually done after considering the margin of error and the budget. The margin of error (also referred to as a “confidence interval” by statisticians) tells how closely a sample is likely to reflect a target population. Most communities demand that it be no larger than five percentage points around any percentage estimate.
Before deciding on a specific method for conducting a survey, communities should consider the cost, speed, and accuracy of a range of alternatives. Standard options for conducting surveys include using mail out-mail back questionnaires, telephone interviews, and in-person interviews.
Other options include publishing surveys in newspapers, distributing them as inserts with utility bills, and “doorknob drops.” While inserting a survey in a newspaper or utility bill may be relatively simple to do, the results will generally be less reliable and accurate than if a more targeted mail or telephone survey (or conducting in-person interviews) were used.
As accuracy is the “touchstone” of survey sampling excellence, it is preferable to use methods where the surveyor has more control over who is surveyed and is in a position to obtain a higher response rate. Indeed, the bias introduced by lack of response can easily overwhelm bias introduced by all other factors combined, and must be minimized as much as possible.
Margins of Error & Confidence Intervals:
The larger the size of your survey sample, the greater the likelihood it will match the target population. However, once the sample size reaches 400 to 500, the increases in precision and accuracy are marginal. Unless statistically significant results from a specific subgroup of the population are needed, sample sizes in this range will suffice for most purposes because the margin of error (i.e., confidence interval) remains at about +or – 5 percentage points around any percent.
So which method should communities use? The highest rates of response are typically achieved by in-person interviews. However, due to the high cost of this method, most surveyors today choose to use telephone or mail based methods. Our research shows that rates of response for mailed surveys (when done properly) have higher response rates than the typical phone survey. A mailed survey (including a pre-survey notification post card and two mailings of the survey) can net upwards of a 35 percent response rate, compared to just under 10 percent response rate from most phone surveys.[ref]The percentage of households in a [telephone] sample that are successfully interviewed — the response rate — has fallen dramatically. At Pew Research, the response rate of a typical telephone survey was 36% in 1997 and is just 9% today.” See Assessing the Representativeness of Public Opinion Surveys (Pew Research Center, May 15, 2012).[/ref]
Surveys by Phone and the Web
Phone:
The response rates by phone have dropped to under 10 percent (as noted above) and that is because most people screen or block their calls or have forsaken land lines for cell phones (approaching 40 percent of all households in the U.S.).
These days, survey research convention calls for about one quarter to one half of all phone surveys to be conducted on cell phones. The cost for such calls is two to four times higher than calls to land lines because potential respondents tend to be younger and less interested in surveys — so they are harder to reach; they are mobile, so they are likely to be in a place where a survey cannot be conducted safely; and they may want to be reimbursed for the minutes a survey eats up from their phone plan.
Web:
Surveys on the Web are cost effective when asking questions of an organization’s members, but Web surveys of the general public have not yet proven themselves to overcome the barrier that excludes folks without access to a Web-enabled computer. Opt-in Web surveys, where anyone can answer your questions, leave great doubt that you have heard from a random sample of residents.
Many Web surveys can be completed on smart phones, but typical citizen surveys are too long for responses on phones or by Tweets.
The modern survey method of choice (when you are not in a rush for results and when you expect that most potential respondents are literate in English or another language to which you can translate the survey) is that old school U.S. Postal Service.
Mailed surveys –- coupled with an option for those selected to respond by the Web -– get the largest response at the lowest cost with the most candid perspectives. And mail surveys avoid the annoyance that comes with telephone interruptions at dinner, in the car or at the coffee shop!
6. Ask the Right Questions — in the Right Way
The heart of every survey is, of course, the questions it contains. That being the case, it really isn’t possible to over stress the importance of careful question selection and wording. Developing a solid questionnaire (sometimes called a survey instrument) is not a torturous task, however. All it takes is the application of a little common sense and attention to the principles of consistency, clarity, simplicity, and fairness.
 In applying the principle of consistency, a surveyor needs to consider whether questions included in a survey will produce similar (consistent) responses from people who feel the same way about an issue and different responses from people who feel differently.
Perhaps the easiest way to observe this principle is through the use of “forced choice” questions, which limit answers to a predetermined list or series. The principle of consistency is not being applied well if differences in survey responses are the result of different interpretations of what the questions mean. Unless they are worded very carefully, open ended questions — which do not require a choice from among a series of alternatives — can produce inconsistent (or at the very least hard to categorize) answers.
The principle of clarity can be respected by developing questions that do not contain vague wording, compound concepts (which combine multiple and possibly conflicting ideas into a single question), misleading assumptions (which assume circumstances that may not be true), and overlapping categories. Common words with vague meanings can be communication sinkholes. Terms like “income,” “frequently,” “transit,” “last year,” or “unemployed” do not mean the same thing to different people. When constructing a survey, a surveyor should replace them with more precise terms.
To achieve simplicity, a surveyor should develop questions that are specific, short, and logical. Specific questions give more reliable answers. Long questions decrease response rates. The overall number of questions that can be asked without driving away respondents depends on the survey method and topic. Generally, ten pages is considered a maximum for written questionnaires, while thirty minutes is the absolute limit for telephone surveys.
Fairness and neutrality are also important factors in survey design. Questions asked in a survey must be presented in a way that does not make any particular response appear most correct or obvious. Questions should have “option symmetry,” that is, when respondents are asked to rate performance or behavior, they should be presented with as many positive choices as negative ones, and individual options should mirror each other (e.g., very good / good / bad / very bad).
In Part 4 tomorrow, Tom Miller concludes his review of 9 “rules” for completing a citizen survey, with:
7. Ask the right person; 8. Test the survey and adjust if necessary and 9. Conduct the survey, check for bias, and interpret the results
Thomas I. Miller, Ph.D., is founder and President of National Research Center, Inc., a survey research firm located in Boulder, Colorado. An expert in research and evaluation methods, Miller is the co-author of Citizen Surveys: A comprehensive guide to making them matter, published by the International City/County Management Association in 2009. His firm, which specializes in surveys that permit communities to compare their results with “peer” communities, maintains an integrated database of over 500 surveys completed by about a one half million residents in 44 states.
Miller would be pleased to respond to readers’ questions about the article through our PlannersWeb Linkedin group page; he can also be reached at: 303-444-7863.