We have now seen how to navigate an example proforma analysis. That’s useful for simply understanding the financial nature of a proposed project. But what moves this from useful to insightful is to use a proforma to test other possibilities and “what if” scenarios. A well-constructed proforma spreadsheet template can be a powerful tool for such testing.
For our residential subdivision case study, let’s use our proforma to see what happens to the project if we adjust a few critical assumptions.
1. Testing Higher Costs
One obvious set of tests is what happens if higher costs are incurred. Increases in costs can come from any part of the project, but for this example, let’s illustrate what happens with three types of higher costs.
The first test we’ll do — and a frequent occurrence in real-world housing development — is to see what happens if the basic bricks and sticks cost of building the homes increases over what was expected. This test is easily done by just increasing the cost per square foot for home construction.
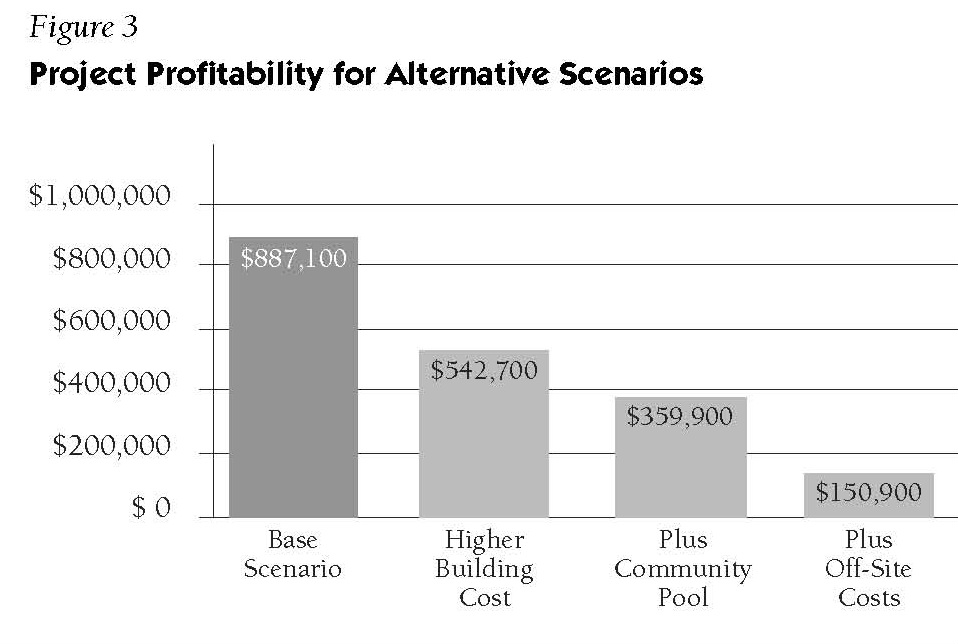
 Raising the construction cost from $65 to $68 per square foot results in higher direct costs per unit of $6,600 per house ($3.00 increase times an average of 2,200 square feet per house). Multiplying this amount by 50 units results in an increased cost of $330,000, which after some additional interest and indirect costs, results in a total cost increase of about $344,000.
As you can see in Figure 3, this reduces the Developer’s Net Cash Return from $887,100 to $542,700. The annualized rate of return is correspondingly reduced from 19.9% to 13.5%.
 That in itself may not be too bad, but let’s say that the builder looks at other projects and decides that to be competitive, a small community pool is needed. The pool, with mechanical equipment, deck area, and pool furniture, could cost about $125,000, plus $50,000 for a small bathroom-changing facility.
The timing of this facility should be nearer to sales opening so as to serve as a marketing inducement, but can wait until sales are at least started, thus minimizing additional interest costs. Adding the pool reduces the net cash return by another $182,800 to $359,900, with the annualized rate of return now dropping to 9.5%.
At this point, however, let us also assume that the Town determines that the existing water system is operating at capacity, and that any expansion to the system would have to include enhanced pumping capacity, to be paid for by the project that requires the expansion. In our “what-if” scenario, let’s say that this improvement would cost another $200,000, and that the Town is requiring adequate water capacity to be in place before final approvals are given, adding to the loan amounts and interest costs early in the project’s operation.
 The developer must now consider whether the project can sustain this additional cost. Of note is that this cost will be spent for improvements that are off-site, and not actually owned by the developer or the new residential community.
Combining the increases in home building costs and costs for additional amenities and off-site improvement results in Total Project Costs increasing by $705,000 — with no compensating cost savings or increases in revenues. The project net cash return is reduced to just under $151,000, representing an annualized rate of return of only 4.3% and an IRR of 4.5%.
This rate of return is now on a par with simple CD and bank note interest, and not worth the risk and effort required for this project to be built. If these changes prevail without compensating savings in other areas or increased revenues, the developer is likely to seek other, more profitable, prospective projects in which to invest.
2. Testing Impacts of Time
Building real estate is a huge gamble. You can spend millions of dollars on acquiring the land and preparing the project, and you can study trends in the market, but you won’t know for sure how well a project will rent or sell until you’re actually open for business.
Sales pace is very often the way in which a project’s reality departs from expectations. We can use the proforma template to look at what happens if the project sells faster — or alternatively, slower — than the original baseline analysis.
Our original baseline analysis assumed an average sales pace of three units per month. What happens if the project is a huge success?

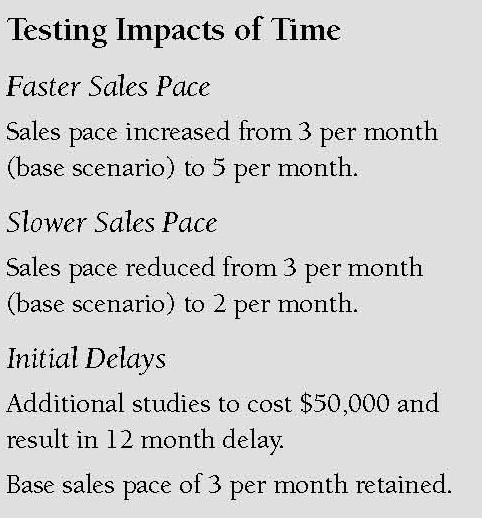
Increasing the average sales pace to five sales per month would need to be accompanied by also accelerating some other aspects of the project.
For example, the community amenities would have to be completed by the time the project sells out. Under this scenario, there is a savings in costs of $148,600. The Net Cash Return to Developer is enhanced by $199,500, which improves the annualized rate of return to 23.2% and the IRR to 30.4%. With sales going so well, the builder may also be inclined to raise prices, enhancing the bottom line even further.
On the other hand, what happens if sales are slower than expected?
If we adjust the average pace of sales to only two units per month, significant cost increases are incurred. Management and Overhead costs keep running for a longer time, the project carries longer, and interest costs mount up. This alternative scenario results in a reduction of net cash return by more than $295,000 below the baseline analysis.
The project would still be profitable, but with an annualized rate of return reduced to 14.4% it may not be as attractive as an alternative project the builder might consider.
Another, and very typical, time impact would be a delay experienced in the approval process. If additional environmental or engineering studies are needed, there would be the direct cost of these additional services. But deferring the opening of sales significantly would also increase carrying costs at a time when there are no offsetting revenues.
 If, in our case study proforma, we add about $50,000 in additional study costs, but also delay the opening of sales by 12 months, financing costs jump by nearly $186,000 (to cover the delay in revenues coming in), and the project’s net cash return suffers by nearly $260,000 compared to the base scenario, reducing the annualized rate of return to 11.6%.
Clearly, time delays are the enemy of profits in real estate development.
3. Testing Home Affordability
Let’s use the proforma template to explore issues of home affordability. How can homes be brought to market that are more affordable?
In our example, the direct bricks and sticks costs (as well as the approval, permit, overhead, and interest costs) are pretty well established and not easily reduced. Remember that the direct unit construction costs are less than half of total costs, so reducing the direct construction costs by, say, 10% might lead to a savings of perhaps less than 5%.
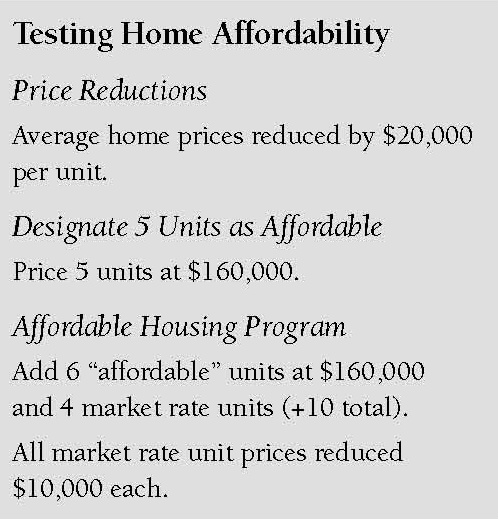
What would happen if the builder simply slashed his sales prices by $20,000 for all of the units? This scenario is easily run by changing the average sales value. If we implement this change, corporate overhead costs actually come down since those costs are pegged to sales revenues — an estimated savings of about $48,000.
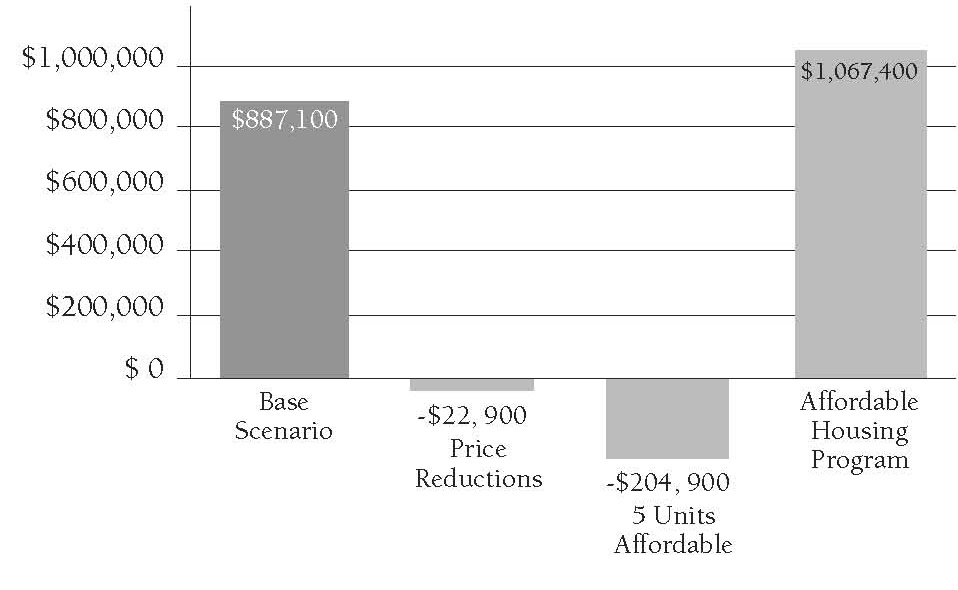
 But the $1.0 million drop in total revenues from this price reduction is huge. The total impact to the project is that the net cash return is insufficient to pay all of the financing costs, and the project actually loses money, posting a negative return of nearly $23,000. And while a $20,000 price savings is not insignificant, it is far from a dramatic break-through in affordability. Simply cutting prices without commensurate cost reductions isn’t supportable by private sector builders.
Another issue for housing affordability is the impact of higher costs, such as those we’ve tested in the previous scenarios. Increases in costs are not necessarily going to come out of the builder’s profits — he’s equally likely to reach for the price list.
For example, to restore the original net return of the base scenario after absorbing all the increased costs seen in our first set of tests (see Figure 3, Testing Higher Costs, Plus Off-Site Costs column), the builder would have to increase the average unit prices by about $16,200.
If the builder feels that such an increase will be accepted by the market, he would prefer to do that rather than diminish his profits. Perhaps the builder will consider a slight reduction in profits with only an $8,000 price increase. But adding costs to a project, including project enhancements or off-site improvements that might be requested by the Town, can very easily show up as increased prices for the homes.
What about more formal affordable housing programs? Let’s say that the Town that is reviewing the application for our hypothetical development is considering implementing a new policy that 10% of all new housing be “affordable,” with prices set as a multiple of median income for the area.
 Using our proforma template, we can see how this might work. Let’s first see what happens if we simply set the price of five of the units to an affordable price level established by income formula of $160,000 (compared to the market price of $400,000). The immediate impact on the project is dramatic, resulting in a reduction in revenues of $1.2 million, and a loss for the developer of nearly $205,000, compared to the baseline scenario. (See Figure 3, Testing Home Affordability, third column).
However, if more market-rate units are allowed, the developer can recover the reduction in profits. This could be achieved if, for example, the project’s density were increased. Compared to the original baseline scenario of 50 market-rate units, we could add four market-rate units and six affordable units, thus bringing the total unit count up to 60 and achieving the Town’s new policy of 10% affordable allocation.
The increased revenues from the additional market rate units would counterbalance the cost impact of the affordable units, as well as cover an increase in the land purchase price resulting from the additional market rate units. Moreover, the developer might even be able to trim the prices of all the market rate units by about $10,000. At the same time, the net cash return actually increases from the baseline scenario by $180,300, raising the annualized return rate from 19.9% to 21.8%, and the IRR from 22.4% to 24.9%. (See Figure 3, Testing Home Affordability, last column.)
 This is the proverbial win-win solution, made possible by a modest increase in project density. Not only do we end up with a viable project, but we have 6 affordable units (one more than originally called for), and all of the market rate units can potentially be made a little more affordable. Solutions like this can be found with insightful use of the proforma.
Summing Up:
 Understanding the basics of the business of development — like understanding the basics of site plans, traffic analysis, and other essential tools used in the field of planning and development — will help you be a better informed and more effective citizen planner.
Knowing how to read a proforma can give you a better understanding of what goes into putting together a project. Through our case study hypothetical, we have seen how changes in several parameters — increased construction costs, the addition of amenities, time delays, and various municipal requirements — can affect a project’s bottom line and its viability.
Author Wayne Lemmon offers some additional observations about developers and risk.
The late Wayne Lemmon was a real estate market economist with a degree in architecture from Cornell University, and urban planning from the City College of New York. He had over 30 years of experience with national real estate consulting firms and development organizations, and served as the Director of Market Research for a regional homebuilder.
Lemmon was also a member of the Planning Commissioners Journal’s Editorial Advisory Board. In addition to Pro-Forma 101, Lemmon authored “The New ‘Active Adult’ Housing” in our Summer 2003 issue.