Yesterday I highlighted the Twitter Town Hall organized by the Partnership for Sustainable Communities. The PSC is an interagency partnership (yes, there are such things!) between EPA, HUD, and DOT. I also want to alert you to a useful new tool the PSC now provides on their web site. Called, “HotReports,” it allows you to measure how your county is doing on several “sustainability indicators” — which you can then quickly compare to statewide and national averages for the same indicator.
 While I would have preferred that PSC called the site (by the more mouth watering name) HotDogs, instead of HotReports, that’s a minor quibble! In fact, HotReports offers a pretty satisfying array of data — which the PSC says will be growing.
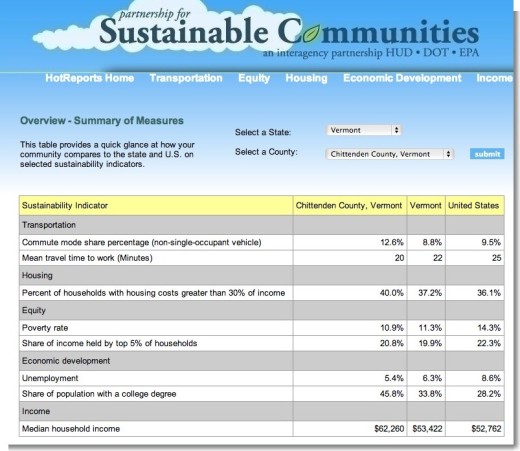
For example, here’s a screenshot I just took of the county we’re located in: Chittenden County, Vermont. You can see data related to transportation, housing, equity, economic development, and income.

By using the various tabs on the HotReports web page, you can also view data in graphic form (showing municipalities within the county) or as tables. Take a look and test it out with your own county — or whatever county in the U.S. you like.
Here’s what the Partnership for Sustainable Communities says about HotReports:
It’s designed to give community leaders and residents a quick and easy way to determine how well your community is performing on a variety of sustainability indicators.
You can select your community and view charts, tables, and maps showing performance trends over time. You can also select other communities that you consider as “peer” or comparison communities.
In the tradition of integrating disparate data to create new and useful products begun by the US Census Bureau’s Data Web and Applications Staff, the Sustainable Communities HotReport searches an online network of public databases, known as TheDataWeb, and knits together a series of interactive web pages that incorporate calculations, maps, charts, text, and tables on demand. … The data in TheDataWeb are live streaming and automatically updated, provided in nonproprietary format at no cost to the public, using official Census metadata. As this integrated database is expanded in the future, more indicators will be added to this report.